Cybereason XDR
This topic contains details on new features added for Cybereason XDR.
In this topic:
February 2024
During this month, we have fixed some outstanding issues.
Fixed issues - February 2024
During this month, we have fixed these open issues:
XDR Dashboard |
In the XDR Dashboard screen, in the Events Ingested Over Time widget, if there are five or fewer integrations, the tooltip for the graph unnecessarily displayed 0+ integrations at times when hovering over points in the graph. We have resolved this issue and the graph does not display 0+ integrations. |
Suspicious events |
If you tried to update the status of a suspicious event in the Suspicious events tab of the XDR MalOp details page, the status did not update correctly for the event. We have resolved this issue and the status of a suspicious event updates in both the XDR MalOp details page and the Suspicious events screen. |
XDR Dashboard |
In the XDR Dashboard screen, in the Alert noise reduction graph, environments in Japanese reported an extra field in the graph about total integrations (which is not relevant to this graph). We have resolved this issue and the Total integrations details are no longer displayed in the Alert noise reduction graph. |
January 2024
During this month, we have added new enhancements, and fixed some outstanding issues.
Enhancements - January 2024
We have updated the following improvements to existing features:
XDR MalOp details |
In the XDR MalOp details, the various tabs for the main part of the screen (Overview, Suspicious events, and Detected elements are now displayed at the top of the XDR MalOp details screen instead of the bottom. |
Fixed issues - January 2024
During this month, we have fixed these open issues:
XDR MalOp details |
In the XDR MalOp details, in the Detected Elements tab, if you select an indicator and then use the option to Search for.., when you return to the Detected Elements tab, the dropdown lists to select a step or a response action no longer display correctly. We have resolved this issue and the dropdown selector lists continue to function as expected even if you use the Search for.. options on an indicator. |
December 2023
During this month, we have fixed some outstanding issues.
Fixed issues - December 2023
During this month, we have fixed these open issues:
XDR MalOps/XDR MalOP details |
In the XDR MalOps screen and the XDR MalOp details screen, for values that did not fit in the viewable space for the column, when viewing the tooltip that reported the full value, you were not able to scroll vertically or horizontally as needed to view the full value. We have resolved this issue and you can now scroll the tooltip as needed to see the full value. |
Suspicious events |
In the Suspicious events screen, in columns that had values you could copy and displayed the Copy button, the copy button was unexpectedly able to scroll which resulted in multiple tooltips unnecessarily displaying in the screen. We have resolved this error and the Copy button will not scroll with the screen. |
November 2023
During this month, we have fixed some outstanding issues.
Fixed issues - November 2023
During this month, we have fixed these open issues:
XDR Dashboard |
In Japanese environments, in the XDR Dashboard screen, when viewing the Events ingested over time graph, the tooltip displayed only the amount of text that could display in the area allotted for the graph on the screen, even if there was additional information that needed to display in the tooltip. We have resolved this issue to ensure that the tooltip can display outside the area allotted for the graph if there is additional data to include in the tooltip. |
XDR MalOp details |
In the XDR MalOp details, in the Response tab, every time you selected the Response tab the Cybereason platform refreshed the tab (even though there was no new information reported in that tab). We have resolved this issue and the Response tab does not refresh every time you select the tab. |
Integrations |
In Japanese environments, when you viewed the integration error banner and clicked on the banner to resolve the error, the Cybereason platform tried to direct you to the Cybereason Connect screen, which is not available in Japanese environments. We have resolved this error and this integration error will not direct you to the Cybereason Connect screen. |
XDR Dashboard |
In the XDR Dashboard screen, when viewing details in the Top integrations overview graph, if an integration was in the PAUSED status, the Last log received column reported a value of Invalid date instead of reporting no value. We have resolved this issue and you will see a – string indicating that there is no value available instead of the Invalid date string. |
October 2023
During this month, we have added new features, enhancements, and fixed some outstanding issues.
Enhancements - October 2023
We have updated the following improvements to existing features:
XDR MalOps |
In the XDR MalOps screen, we have added the ability to filter MalOps by MalOp ID (as well as MalOp name. |
XDR Dashboard |
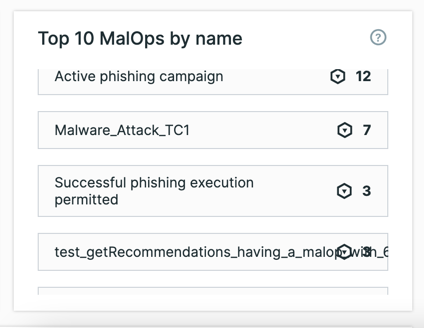
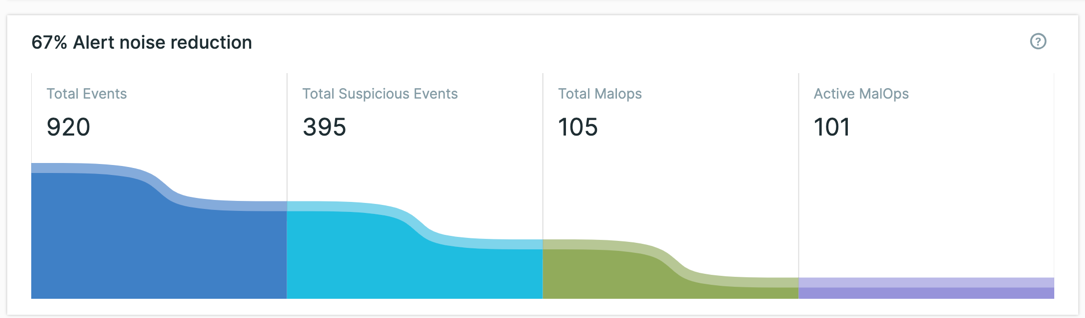
In the XDR Dashboard, we have added an additional graph to display up to 10 of the most frequently occurring MalOps in your environment, in the Top MalOps by Name graph.
In addition, to help you understand the value of the XDR MalOp correlation engine, we have added an Alert noise reduction graph to show the number of items you need to manually triage in your environment.
|
Integration health in the XDR Dashboard |
To help you better understand immediately if there are issues with integrations in your Cybereason XDR instance, in the top bar of the XDR Dashboard, we have added the Integration Health Status widget. If there are are issues with any integration, you can see a message with the number of errors. If there are no issues with any integrations, the status reports OK. Click on the widget to navigate to the My Integrations tab in the Cybereason Connect screen.
|
Cybereason Connect |
To enable you to understand and configure your on-site integrations correctly, we have made a number of changes in the Cybereason Connect screen:
|
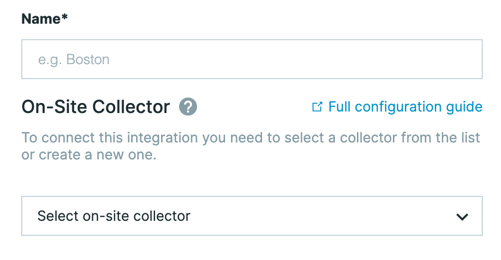
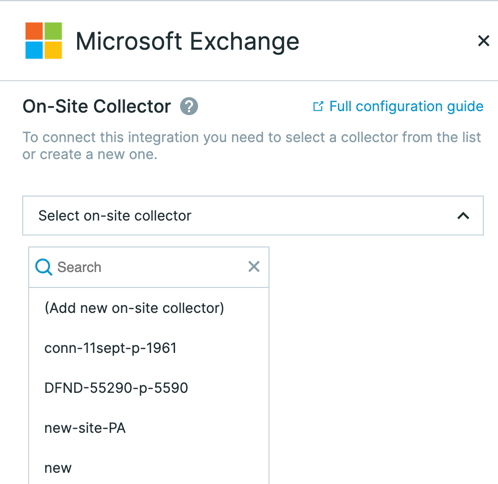
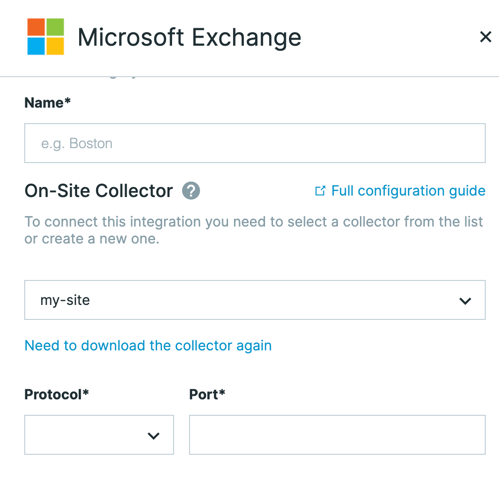
On-site integration configuration |
In the Cybereason Connect screen, to help you understand that it is not necessary to redownload the collector agent again if you are selecting an existing collector agent for a new integration, we have added an option to Download the collector again. You can use this option if another user has deleted the existing collector agent files, but if the existing collector agent is still running, you do not need to redownload the files again.
|

September 2023
During this month, we have added new features, enhancements, and fixed some outstanding issues.
New features - September 2023
We have added the following new features in Cybereason XDR:
Response actions for network integrations |
You can now perform the Block IP address* response action for selected integrations in the **Network module, including:
Through an XDR MalOp, you can elect to add an IP address to the blocklist in your Fortinet Fortigate Firewall or Palo Alto Firewall. After you select this option and perform the operation, Fortinet or Palo Alto will retrieve the updated blocklist to apply in the firewall in your environment. The Cybereason platfrom also adds the IP address to the Cybereason blocklist in the Reputations screen with a Block value in the XDR Action column. For more details, see Perform response actions for network platform. |
Enhancements - September 2023
We have updated the following improvements to existing features:
XDR MalOps and suspicious events |
In the XDR MalOps and Suspicious events screens, we have added the ability copy any value from any field. Next to all fields, you will see the Copy icon where you can copy the value to your local clipboard. |
Suspicious events |
To help you view suspicious events in a more meaningful way and identify those events which require immediate attention, we have added a filter in the Suspicious events screen to enable you to display events related to MalOps. You can filter by:
|
Fixed issues - September 2023
During this month, we have fixed these open issues:
XDR MalOps |
In Japanese environments, when viewing the statuses of an XDR MalOp, the values for the MalOp status were not translated into Japanese. We have resolved this issue and MalOp statuses now display translated into Japanese. |
XDR Dashboard |
In the XDR Dashboard screen, when clicking a section of a graph to view a detailed list of items in the graph, the counts displayed in the graph in the XDR Dashboard screen did not match the count of items displayed on the respective screen (XDR MalOps or Suspicious events). We have resolved this issue and the counts on the XDR Dashboard screen for any section of a graph match the items on the specific screen. |
XDR Dashboard |
In the XDR Dashboard, when opening the Dashboard, the graphs on the bottom part of the screen were not visible, and it was not possible to view the full content of the graph. We have resolved this issue and you can now scroll to see all the graphs in the Dashboard. |
XDR MalOp details |
In the XDR MalOp details, when viewing details on IP addresses in various places throughout the MalOp details, the icon for the IP address was not always the same. At times, the icon was a solid black icon while other times it wa the icon with the IP character inside the icon. We have resolved this issue and the icon will display correctly (with the IP characters) in all places throughout the MalOp details. |
Suspicious events |
In the Suspicious events screen, in the Detection time column, if you copied the value, the copied value was epoch time instead of the expected DD-MMM-YYYY-HH:MM time zone format. We have resolved this issue and the copied time format will be the expected format. |
XDR Dashboard |
In the XDR Dashboard screen, when viewing the Integrations by Health Status graph, previously paused integrations were not included in the total count in the graph. We have resolved this issue and the Integrations by Health Status graph will also report paused integrations. |
XDR MalOp details |
In the XDR MalOp details, when changing the status using the status drop down in the MalOp details, the Summary pane did not update the status to match the status change in the drop down. We have resolved this issue and the status in the Summary pane updates accordingly with the status drop down. |
XDR MalOps |
In the XDR MalOps screen, in the Status column, the value reported in the Vendor.<status> string instead of just the status. We have resolved this issue and the Status column reports only the Status value. |
August 2023
During this month, we have added new features, enhancements, and fixed some outstanding issues.
Enhancements - August 2023
We have updated the following improvements to existing features:
XDR MalOps |
We have updated the logic used by the MalOp detection engine to make the names of generated MalOps clearer. Now the MalOp names will indicate more clearly the attack sequence represented in the MalOp so you can look for similar MalOp more easily. |
XDR MalOps and Suspicious events screens |
In fields in both the XDR MalOps and Suspicious events screens, if a value is longer than the space available to display the value, we have added 3 dots and a Copy button to indicate there is more of the value to display. |
XDR screen usability |
In all XDR screens, we have ensured that the name for the different time filters are the same on all pages. |
Fixed issues - August 2023
During this month, we have fixed these open issues:
XDR MalOps screen |
In the XDR MalOps screen, when hovering over the list of recommendations in the Recommended actions column, you could see a link to display more recommendations even though all the recommended actions were already displayed. WE have resolved this issue and you will no longer see a link to view more recommendations when there are no additional actions to display. |
XDR MalOps screen |
In the XDR MalOps screen, if you select an option for how many MalOps to show on a page, and then navigate to a specific page in the results, you were no longer able to see the MalOps by name. We have resolved this issue and the MalOp search will continue to work even when using pagination options in the XDR MalOps screen. |
July 2023
During this month, we have added new features, enhancements, and fixed some outstanding issues.
Enhancements - July 2023
We have updated the following improvements to existing features:
XDR MalOps |
In the XDR MalOps screen, you can now right-click a MalOp name to open the MalOp details in a new tab. |
XDR Dashboard |
In Japanese environments, in the XDR Dashboar screen, in the MalOp status graph, we have added translations into Japanese for the various MalOp statuses. |
XDR MalOps screen |
In the XDR MalOps screen, in the filters list, we have added that all the filter values for the Status and Severity filters are selected by default. |
XDR MalOps |
To help managed security service providers (MSSP), for XDR MalOp, we have added the To review status. You can use this status when you have performed your triage on an XDR MalOp but you need the managed customer to approve and cloe the MalOp. |
Fixed issues - July 2023
During this month, we have fixed these open issues:
XDR Suspicious events filters |
In the Suspicious events screen, if you added multiple filters, when viewing the description of the added filters above the list of suspicious events, if you hovered over the filter of the filters, the text in the tooltip description did not display properly. We have resolved this issue and the tooltip with the full filter description displays properly. |
XDR MalOp details |
In the MalOp details of an XDR MalOp, in the Suspicious events tab, if you hovered over the value in a column in the bottom of the grid of suspicious events, the full displayed description in the tooltip displayed behind the tab names in the MalOp details (Suspicious events and Detected elements). We have resolved this issue and the tooltips display correctly in front of the tab names. |
XDR MalOp details - Suspicious events tab |
In the XDR MalOp details, in the Suspicious events tab, when you selected a suspicious event to display details of the suspicious event, the pane with the event details displayed behind the tab names of the XDR MalOp details. We have resolved this issue and the suspicious events details are not displayed behind the tab names. |
XDR MalOps |
In the XDR MalOps screen, the name of the status column was different in the pane where you selected what column to display and the actual column name. In the pane to select columns, the status column was labeled Investigation status, whereas in the MalOps list, the column name was actually Status. We have resolved this issue and the name is the same in the column visibility selection name and in the MalOp grid. |
Suspicious event from Cybereason NGAV/XDR |
For suspicious events from the Cybereason NGAV and Cybereason XDR data sources, in the suspicious event details, the links displayed to navigate to the Investigation, Attack Tree, and Machine Timeline screens were not always working properly in some environments. We have resolved this issue to ensure that these links work in all environments. |
XDR MalOps screen |
In the XDR MalOps screen, in the grid with the list of MalOps, if you were able to copy a value in the grid, the Copy button was displayed over the text for the value. We have resolved this issue and the copy button no longer displays over the value text. |
XDR MalOp details |
In the XDR MalOp details, in the Response tab, when viewing the tooltips for various response recommendations, for the second recommendation block and other lower recommendation blocks, the tooltip block displayed the existing text (such as the Show __ more string) instead of showing the tooltip in front of other UI elements. We have resolved this issue and the tooltip displays as expected in front of all other UI elements. |
XDR MalOps screen |
In the XDR MalOps screen, in the Recommende response column, the column did not sort values correctly. We have resolved this issue and the column values should sort as expected. |
XDR MalOps and Suspicious events screen |
In the XDR MalOps and the Suspicious events screen, in the Filters pane, if you opened the filter to select a time range, and then scrolled down the list of filters, the opened filter with the values for the time range disappeared when you scrolled down the list of filters instead of remaining open at the top of the screen. We have resolved this issue and the filter should display at the top of the screen as expected when scrolling through the list of filters. |
XDR MalOps |
In the XDR MalOps screen, if a MalOp did not have any response recommendations, in the Recommended response column in the MalOps grid, the Copy button was still visible. We have resolved this issue and the Copy button icon is no longer visible if there are no values. |
June 2023
During this month, we have added new features, enhancements, and fixed some outstanding issues.
Enhancements - June 2023
We have updated the following improvements to existing features:
XDR MalOps |
In the XDR MalOps screen, you can now right-click a MalOp in the list and open the MalOp in a new browser tab. |
XDR Dashboard filters |
We have added a 1 year filter in the XDR Dashboard screen to enable you to see more data from a longer period. |
Fixed issues - June 2023
During this month, we have fixed these open issues:
XDR Dashboard |
In the XDR Dashboard screen, when clicking a section of a graph to view a detailed list of the items in the graph, the counts displayed in the graph in the XDR Dashboard screen did not match the count of items displayed on the respective screen (XDR MalOps or Suspicious events). We have resolved this issue and the counts on the XDR Dashboard screen for any section of a graph match the items on the specific screen. |
XDR Dashboard |
In the XDR Dashboard screen, if you set a time filter for the Dashboard data, but then clicked a section of any graph to view a detailed list, the detailed list did not use the same filter selected in the XDR Dashboard screen. We have resolved this issue and the screen opened from the XDR Dashboard usees the same time filter from the XDR Dashboard when clicking on any section of the graph. |
XDR MalOps/Suspicious events |
In the XDR MalOps page, if you add a column to the visible columns or sort a column in the MalOp list, after you refresh the page, the column state (for example of a column being made visible or a column sorteed in a certain way) is not maintained and the column view reverts to the previous state. We have resolved this issue and the column state is retained after a page refresh. |
XDR MalOps |
In the XDR MalOps screen, when viewing the screen on machines with small screens (such as 13 inches or smaller), when you open the filters panel at the left side of the screen, certain columns and the Set status to button were not visible and you could not scroll to the right side of the screen horizontally to view these buttons. We have resolved this issue and full contents of the XDR MalOps screen are always visible even when other panels are open. |
XDR MalOps |
In an XDR MalOp, if a MalOp had a large number of Detected elements, when viewing the Detected elements tab, the contents of the tab would block part of the tabs display in the main part of the MalOp details. We have resolved this issue and the tabs at the bottom of the XDR MalOp details (Overview, Suspicious events, and Detected elements), are always visible, even when there are a large number of items in Detected elements tab. |
XDR MalOp details |
In the XDR MalOp details, after viewing a number of MalOps, at times, when opening a new MalOp, the MalOp opened to the Response tab instead of the summary details as expected. We have resolved this issue and each MalOp opens the summary details as expected. |
Suspicious events |
In the Suspicious events screen, at times, if you used the search filed to search for an event, and clicked on the screen elsewhere, but then again clicked on the search field again, the original search field would not close and two dropdown menus would display for the second search. We have resolved this issue and only one search field is displayed, and the search dropdown closes as expected when clicking elsewhere on the screen. |
XDR MalOps |
In the XDR MalOps screen, if you searched for a MalOp title, and then opened the MalOp from the list of results, when you returned to the main XDR MalOps screen, the search results were not retained. We have resolved this issue and the search results are now retained when returning to the screen when viewing a specific MalOp result. |
May 2023
During this month, we have added new features, enhancements, and fixed some outstanding issues.
New features - May 2023
We have added the following new features in Cybereason XDR:
MalOp detection engine |
To improve the accuracy and validity of MalOps created by Cybereason XDR, we have added the XDR MalOp detection engine as part of the detection mechanism used by Cybereason XDR. This engine analyzes suspicious events, aggregates these events into steps, and correlates steps together when the events meet certain characteristics and common indicators. For details on the MalOp detection engine, see Examine XDR Malops. |
Enhancements - May 2023
We have updated the following improvements to existing features:
Suspicious events |
For suspicious events from Cybereason NGAV or Cybereason EDR, in the Suspicious event details, you can now see a link to the relevant Endpoint Protection or AI Hunting MalOp. |
XDR MalOps |
You can now search in the XDR MalOps screen using the MalOp ID for Endpoint Protection and AI Hunting MalOps. |
Fixed Issues - May 2023
During this month, we have fixed these open issues:
Detected elements tab |
In some cases, in the Detected elements tab of an XDR MalOp, you could see indicators for the Login Elements when the Login Elements indicators were not relevant for the MalOp (such as network activities, for example). We have resolved this issue and you should only see the indicators for the Login Element in relevant scenarios. |
Detected elements tab |
In an XDR MalOp, in the Detected elements tab, when you click the button to search for the indicator, the box to display the search options for an indicator was hidden behind other UI elements. We have resolved this issue and when you display the search options box for an indicator, the box displays correctly. |
April 2023
During this month, we have added new features, enhancements, and fixed some outstanding issues.
New features - April 2023
We have added the following new features in Cybereason XDR:
EDR events in the Suspicious events screen |
You can now view events from Cybereason EDR alongside other events in the Suspicious events screen. The events from Cybereason EDR include events related to AI Auto Hunting MalOps generated by the Cybereason platform. For more details, see View suspicious events from your Cybereason platform. |
Enhancements - April 2023
We have updated the following improvements to existing features:
XDR Dashboard |
In the XDR Dashboard, when clicking on a section in the graph in the Active MalOps by Severity group, Cybereason XDR will redirect you to the XDR MalOps page to display all MalOps with the statuses of New or Under Investigation and the selected severity. Previously, all MalOps, regardless of status, were displayed. |
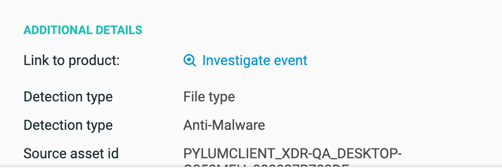
Suspicious events from Cybereason NGAV |
In the Suspicious events screen, when viewing suspicious events from Cybereason XDR, in the Additional Details section, you now have the option to investigat events in the Investigation screen to learn more.
|
Additional details for Login elements in the Detected elements tab |
When viewing details on the Detected elements tab in an XDR MalOp, you can now see new fields:
|
March 2023
During this month, we have added new features, enhancements, and fixed some outstanding issues.
New features - March 2023
We have added the following new features in Cybereason XDR:
NGAV events in the Suspicious events screen |
You can now view events from Cybereason NGAV alongside other events in the Suspicious events screen. The events from NGAV include evxwents related to Endpoint Protetion MalOps generated by the Cybereason platform. For more details, see View suspicious events from your Cybereason platform. |
Detected elements tab in an XDR MalOp |
In an XDR MalOp, you can now use the Detected elements tab to view related indicators for the MalOp. These related indicators can help you see other indicators of attack or behavior to determine if a MalOp is genuinely malicious and needs immediate attention. For more details, see Analyze the indicators of behavior in a MalOp. |
Fixed issues - March 2023
During this month, we have fixed these open issues:
XDR MalOps |
In the XDR MalOps screen, when trying to sort a column, the sorting worked only when you clicked on the column name, but not in the entire area of the column as expected. We have resolved this issue and clicking to sort a column works when you click the column header area. |
XDR MalOp details |
In the XDR MalOp details, when viewing a step card, if the details contained a large number of values for the Source identity and Target identity, it was not possible to scroll and see the additional values that were displayed. We have resolved this issue and you can scroll to see all values for the Source identity and Target identity. |
XDR MalOp details |
In an XDR MalOp, when viewing the Suspicious events tab, you could only view the first 100 events associated with the MalOp. We have resolved this issue and if your MalOp contains more than 100 suspicious events, you are able to view additional pages of these events to ensure you can see all events. |
XDR MalOp details |
In an XDR MalOp, when viewing the step details card, if you tried to click the link for a MITRE ATT&CK tactic/technique/sub-technique to view the relevant page in the MITRE ATT&CK site, the link did not open the page. We have resolved this issue and clicking the MITRE ATT&CK link will open the relevant page. |
XDR MalOps |
In the XDR MalOps screen, when viewing the list of MalOps, if a MalOp name was the MITRE tactic/technique/sub-technique, the MalOp name was displayed with the tactic/technique/sub-technique ID number along with the name. We have resolved this issue and the MalOp name displays correctly with only the tactic/technique/sub-technique name. |
XDR Dashboard |
In the XDR Dashboard, the Active MalOps by severity graph displayed an incorrect count for the active MalOps. We have resolved this issue and this widget now displays the correct total count. |
February 2023
During this month, we have added new features, enhancements, and fixed some outstanding issues.
New features - February 2023
We have added the following new features in Cybereason XDR:
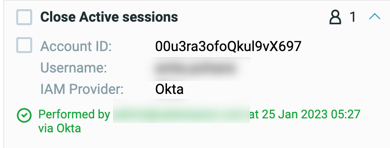
Perform response actions in integrated platforms directly from Cybereason XDR |
You can now perform response actions in your connected platforms directly from Cybereason XDR. Currently, the response actions are possible in the following integrated platforms:
For each integraiton, you enable the response actions you want in the Access Details pane in the integration in the Connect screen. After you enable the required actions, you must also add the required permissions in your connected platform. Once you have enabled the actions and provided the permissions, you can then instruct Cybereason XDR to take specific actions in the Response tab in the XDR MalOp details.
For details on how to perform response actions, see Perform Response for XDR MalOps. For details on how to set up the response actions and provide permissions, see the relevant tab in the integration pages in the Cybereason Integrations documentation: |
New integrations |
We have added support for the following new integrations:
For details on how to set up these integrations, see: |
Enhancements - February 2023
We have updated the following improvements to existing features:
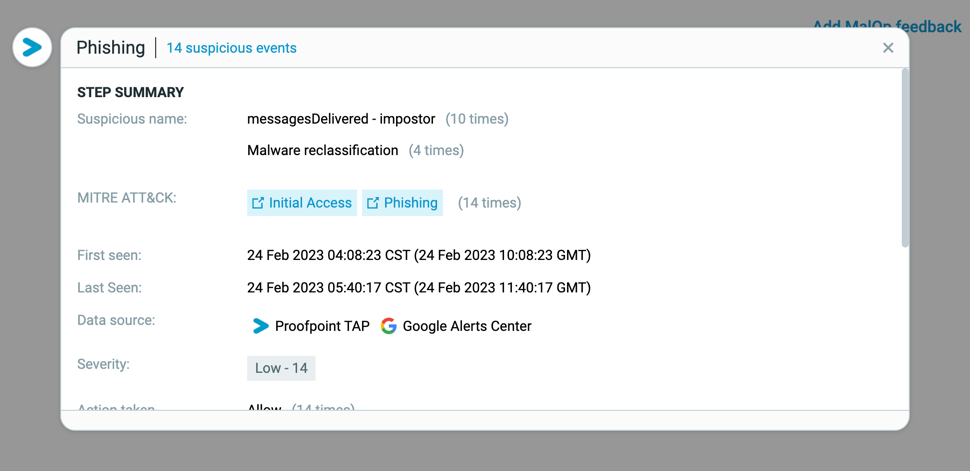
Card view for steps in XDR MalOps |
When viewing a step in an XDR MalOp, instead of only viewing the step details in the Summary pane at the left, the details display in a card view in the main part of the XDR MalOp details.
This view helps you see:
If a MalOp contains a single step, the card displays by default. |
MalOp statuses |
To help you analyze XDR MalOps in a more effective way, we have added the Close irrelevant and Reopened statuses for XDR MalOps. You can set the Close irrelevant status in an XDR MalOp if the MalOp is a false positive in your environment. If an XDR MalOp needs to be reopened, the Cybereason platform will set the status to Reopened (but you cannot set this status manually). |
User experience for XDR MalOp details |
In addition, in the XDR MalOp details, we now display a fuller summary for each step of the MalOp, including sections for:
|
Add MalOp feedback |
In the XDR MalOp details, we have added a Add MalOp feedback button to enable you to add feedback on the logic and usefulness of each MalOp. Providing this feedback will help Cybereason improve detection logic to generate MalOps for the correct situations that represent truly malicious behavior, improve the user experience for XDR MalOps, and add meaningful details in the XDR MalOps. |
MalOp details improvements |
In the Summary pane of an XDR MalOp, we have added a number of additional details to help you better understand the scope of the MalOp:
In addition, you can click on the total number of events to navigate to the Suspicious events screen for these events. |
Time-based filters for XDR MalOps |
To enable you to see the most relevant MalOps in your selected time frame, we have updated the time-based filters in the XDR MalOps screen to use the time of the last update of the MalOp’s details, instead of the creation time of the MalOp. |
Time-based filters for XDR MalOps |
To enable you to see the most relevant MalOps in your selected time frame, we have updated the time-based filteres in the XDR MalOps screen to use the time of the last update of the MalOps details, instead of the creation time of the MalOp. |
Role-based access to the XDR screen |
We have limited access to the XDR screen (containing the XDR Dashboard, XDR MalOps, and Suspicious Events tabs) to users with the following roles:
Users with other roles will not have the XDR screen in the left navigation menu, even if XDR is enabled in the environment. |
Fixed issues - February
During this month, we have fixed these open issues:
Suspicious events screen |
In the Suspicious events screen, when you clicked the Copy button in some columns with an object (such as the Target Identity column) to copy a value, the browser saved the value [Object Object] instead of the string you wanted to copy. We have resolved this issue and the copy button copies the correct value in these column. |
Suspicious events screen |
At times, in the Suspicious events screen, suspicious events were displayed without mandatory data, such at the event name. We have resolved this error and all mandatory parts of the suspicious events are now displayed. |
XDR MalOps |
When viewing MalOp counts in both the XDR Dashboard screen and the XDR MalOps screen, at times the counts for the number of MalOps differed. We have resolved this issue and now MalOp counts are the same in all places. |
XDR MalOp details |
In the XDR MalOp details, if you displayed the associated events for the MalOp by clicking on the step list in the Summary pane > Scope section, and then later changed the step to display with the dropdown list above the event list, the events displayed did not update based on the selected step from the dropdown list. We have resolved this issue and related events for a MalOp update correctly when you select a step from all places within the XDR MalOp details. |
January 2023
During this month, we have added new features, enhancements, and fixed some outstanding issues.
New features - January 2023
We have added the following new features in Cybereason XDR:
Recommended response for XDR MalOps |
To help you better understand how to take action on activity that led to the creation of an XDR MalOp, we have added a Response section to the XDR MalOp details. These recommendations, which are created only when the connected vendor product has not taken a remediation action (such as block an IP address), help you understand:
For more details on response recommendations, see Perform Response for XDR MalOps. |
New integrations |
We have added support for the Pulse Secure VPN integration. For details on how to set up the Pulse Secure VPN integration, see the Pulse Secure VPN page in the Nest Integration documentation. |
Enhancements - January 2023
We have updated the following improvements to existing features:
User experience for XDR MalOp details |
We have updated the Summary and Response panels in the XDR MalOp details to display in all the different tabs of the MalOp details. |
Connect statuses for Cloud feed integrations |
We have updated the status displayed for cloud feed integrations in the Connect screen. The new statuses will be:
|
Fixed issues - January 2023
During this month, we have fixed these open issues:
Suspicious events search |
In the Suspicious events screen, when searching for multiple values for the Suspicious name filter with a special character, the results did not always return only the suspicious events that matched the suspicious name string, but instead would return unexpected results. We have resolved this issue and results that match each of the values in the MITRE ATT&CK field will display when you use multiple values. |
December 2022
During this month, we have fixed these open issues:
Suspicious events screen filtering |
When searching in the Suspicious events screen, if you filtered by a specific event name, the screen would remove all the suspicious events in the list. You could refresh the screen to display the events again but then you could no longer filter by the event name. We have resolved this issue and you can now search by event name without issue. |
Suspicious events screen |
When resizing the columns in the Suspicious events screen, the change did not persist when navigating to other screens or in future sessions. We have resolved this issue and the columns in the Suspicious events screen remain as you set them each time you use the Cybereason platform. |
XDR MalOp data integrity |
After viewing the MalOp details for an XDR MalOp, and then performing other browser-based activity (both in and outside of the Cybereason platform), when you returned to the MalOp details again, the data displayed as not always the correct data. We have resolved this issue and the MalOp details displayed in an XDR MalOp are always the correct details. |
Google Alerts Center integration |
In some casese, the Google Alerts Center integration name was displayed as Google - Alerts Center, causing your filters to perform differently when filtering by the integration name. We have resolved this issue and the integration name is always reported as Google Alerts Center. |
November 2022
During this month, we have added the following:
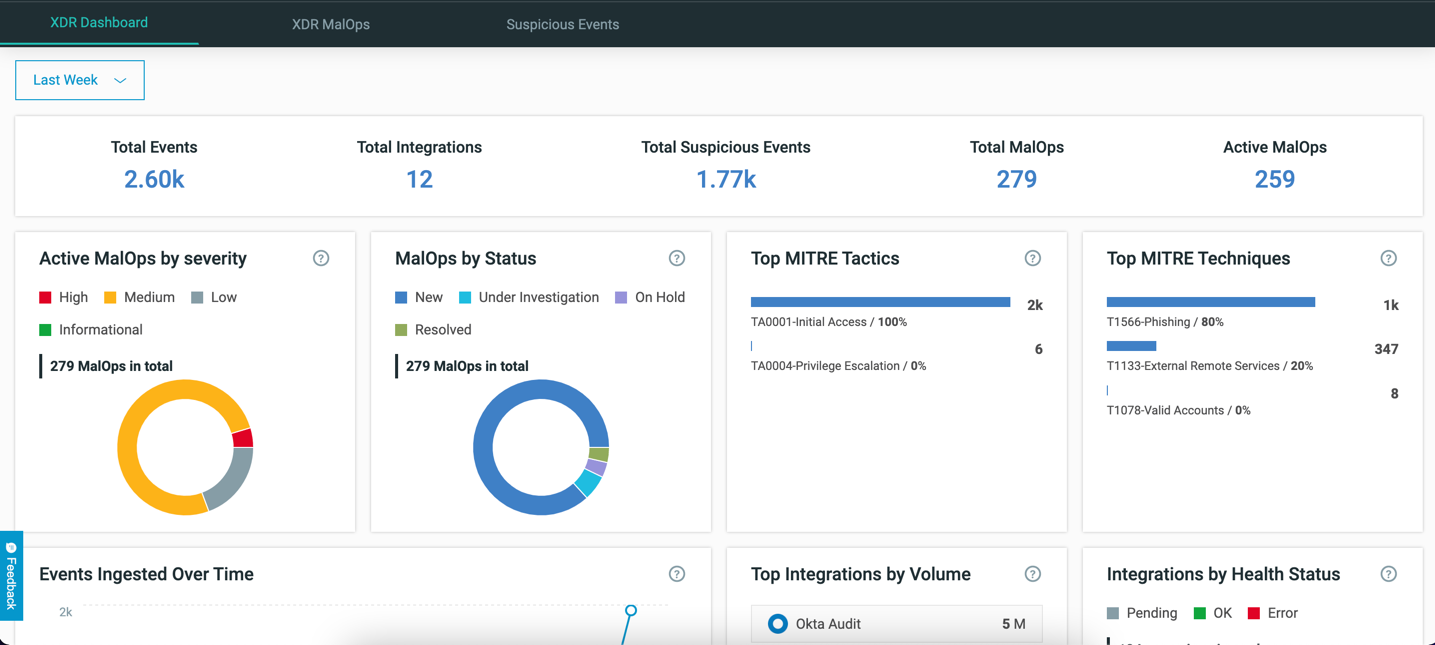
XDR Dashboard |
To help you understand the security value and the health of your XDR platform, we have introduced the XDR Dashboard. The Dashboard, which opens when you navigate to the XDR screen of the Cybereason platform, provides a number of key data points for your Cybereason XDR instance:
For more details on the XDR Dashboard, see XDR Dashboard. |
XDR MalOp - Suspicious Events tab |
In an XDR MalOp, you now have a tab focused on the suspicious events associated with each step. In this tab, you can see all the suspicious events associated with the step for further analysis and triage. |
Integrations |
We now collect events from Microsoft Defender, as part of the Microsoft Graph Alerts integration. For details on how to set up the Microsoft Graph Alerts integration, see the Microsoft Graph Alerts integration page in the Nest Integration documentation. |
October 2022
During this month, we have added the following:
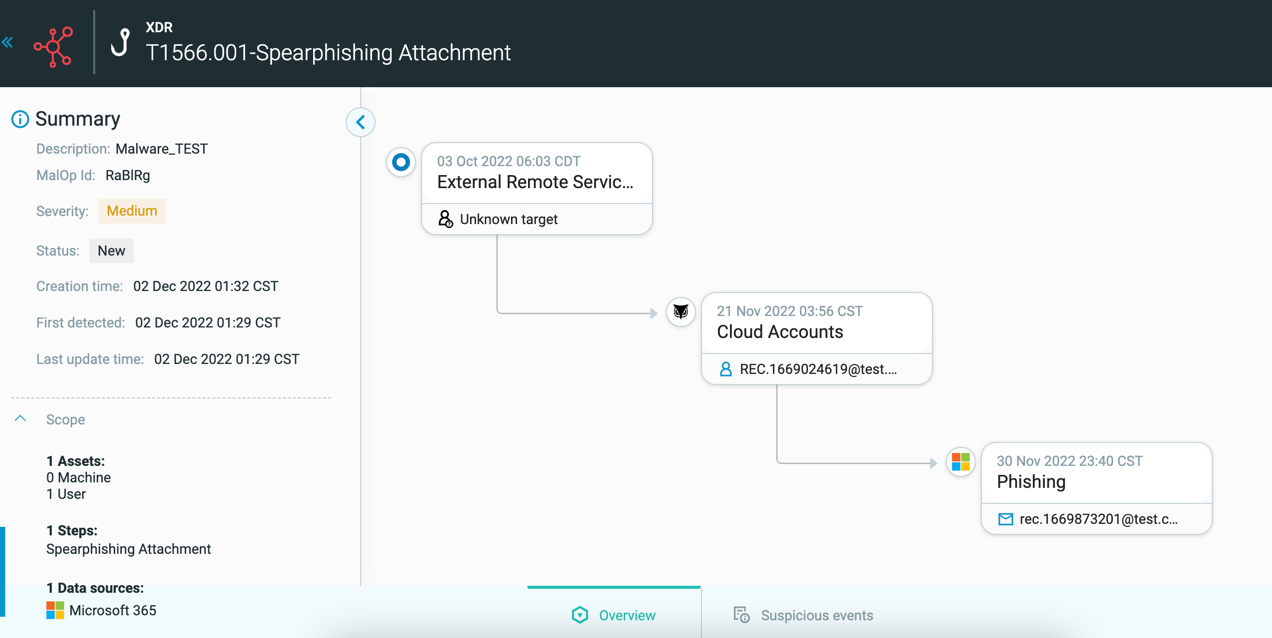
XDR MalOp |
Now, if you have multiple suspicious events that are likely related, Cybereason XDR generates an XDR MalOp to associate these events in a single attack story. The XDR MalOp highlights the end-to-end attack story, generated based on correlated and aggregated suspicious events. A MalOp can be a single step or multiple steps highlighting the timeline and associated with the MITRE ATT&CK tactic, technique, or sub-technique.
You can then view more details about each step to help you understand the detected activity. For details on the XDR MalOP, see Examine XDR Malops. |
New integrations |
We have added integrations with the following platforms:
For details on these integrations, see the integration pages in the Nest integration documentation: |
September 2022
During this month, we have added the following:
Integration with Cisco applications |
We have now added integration with a number of Cisco products, including:
Cisco is the leading network provider in the industry and most customers have one of these firewalls in their network. These integrations will help you ensure you are retrieving data from your Cisco platforms to use in Cybereason XDR. For details on these integrations, see the Integrations pages in the Nest integration documentation: |
Integration with Windows |
In addition, we have added integration with a number of Windows components to enable you to retrieve log details from various Windows areas:
For details on these integrations, see the Integrations pages in the Nest integration documentation: |
August 2022
During this month, We have added the following:
XDR Detections |
Currently, over 250 vendor alerts and Cybereason expert detections are available for integrations in the Workspace, Identity, Network, and Cloud modules. You can view these detections in the Suspicious Events screen. These detections focus on the business email compromise, ransomware, and account takeover use cases. |
Integration with Forcepoint NGFW |
We have added the integration with Forcepoint NGFW to enable you to retrieve data from your Forcepoint NGFW to use with Cybereason XDR. For details on this integration, see the Integration with Forcepoint NGFW integration page in the Nest integration documentation. |
July 2022
During this month, We have added the following:
Triage score |
In the Suspicious Events screen, we have added a Severity column which provides a calculated score which reflects the urgency and seriousness of an event. The Cybereason platform calculates this score based on a number of factors to help you prioritize events in this screen. For more details, see Suspicious Events Severity Score. |